Quantitative analyses on the global coronavirus pandemic

Month: November 2020

Pre-Thanksgiving Dip in COVID-19 Cases

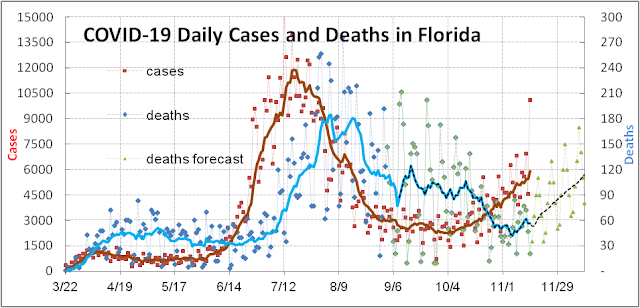
COVID-19 cases in the USA have shown a sharp decrease over the last 8 days causing the 7-day rolling average to peak and rollover (see figure below – red squares).  The question is whether this is measuring a real lasting phenomenon – perhaps attributable to local COVID-19 fires burning out, or to mitigation factors taking hold, or to some temporary factor associated with the Thanksgiving holiday.  The answer is probably a combination of all three that will ultimately be overwhelmed by an increase in Thanksgiving transmission.

Some COVID-19 outbreaks have burned so strongly and for so long (3-4 months) that local “herd immunity” may be acting as a retardant to the fire.  For example, in North Dakota (ND) 10.3% of the population has now been confirmed infected (see table below). 

StateConfirmedTestingEst. PopDeathsDeath perFatality
 Infection %Positive %Infection % million
ND          10.3                23          47          920            1,207            1.2
SD            9.0                24          44          943            1,066            1.2
IA            7.2                19          27       2,400               761            1.0
WI            6.6                15          20       3,307               568            0.9
NE            6.5                17          22          989               511            0.8
UT            6.0                  9          11          868               271            0.4
USA            4.2                  7          15  273,077               825            2.0

Given their low testing rate and associated high positivity rate near 23%, the true underlying infection rate could be 5X to 10X higher than reported (higher positivity rates correspond to a higher hidden population of infectees). This means that ND could have passed the “herd immunity” threshold of 60%-70% estimated by most epidemiologists.  South Dakota (SD) is not far behind at 9.0% confirmed with 24% positivity rate.  Six US states (ND, SD, IA, WI, NE, UT) are already above 6% confirmed infection rate and could be approaching the herd immunity threshold in a few months.  Four of these states (ND, SD, IA, NE) has refused to impose any kind of statewide mitigation measures and avoided testing and thus have a high hidden population of infectees.  Hundreds of counties in the USA could be approaching this threshold.  These states and counties could well reach herd immunity before vaccines become widely available in March.  By then it would be too late for vaccines to save lives already irretrievably lost. 

Letting the virus run wild has come at a great price for the Dakotas.  Both states have now joined the unenviable 0.1% club, that is more than a thousand deaths per million population reached by 10 USA states and only 3 countries in the world: Belgium, San Marino, and Peru.  (For reference the USA as a whole is at #10 in the world with 825 deaths per million.  The USA as a whole is far from herd immunity with just 4.2% of the population confirmed infected and an estimated 15%-20% as the true underlying infection rate.) 

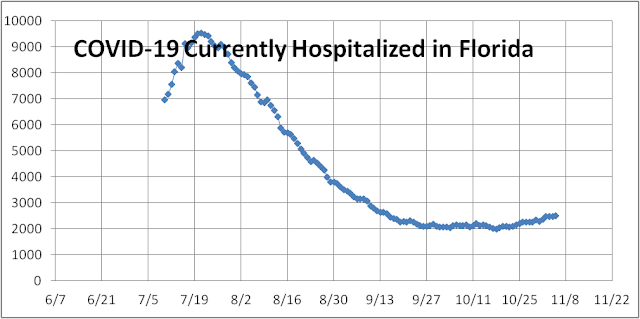
Part of the reason for the recent topping of case counts could be due to the wide range of mitigation measures many counties and states have undertaken recently to flatten the curve and deal with the overwhelming demand for healthcare services (current hospitalizations are 56% higher than ever before in the USA).  These measures include mask mandates (which we view as the cheapest mitigation measure), limitations on assembly, curfews, and business/activity shutdowns.  Many of them could take several weeks to cut transmission and to manifest themselves in the data.  Moreover, many of them are not mandatory and depend on widely varying voluntary compliance.  Given the wide spectrum of responses, it will take some time to sort out which has been effective and which have not.

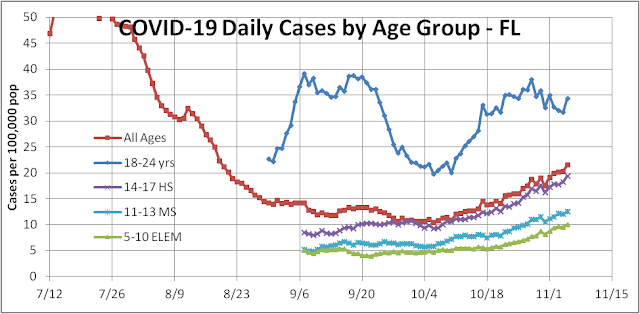
Finally, part of the reason for the recent dip in cases could also be just a matter of timing.  Many young adults including college students got tested for COVID-19 in the days before Thanksgiving, hoping to get negative results and a pass to go home (see graph above).  This raised the number of tests conducted to a record high of 1.98 million tests in the USA on Nov 21st.  91% of these tests came back negative and gave millions “pass” to travel.  Over the last 8 days, the number of tests dropped to 1.28 million on Nov 29th – much of it due to many Americans taking long weekends off for Thanksgiving.  We expect reported tests, cases, hospitalizations, and deaths to increase again soon. 

The incoming Biden administration must take charge of the pandemic war immediately.  We are forecasting that an additional 74.5k Americans will die over the next 4 weeks due to cases and hospitalization already in the pipeline.  Moreover, every day’s delay over the next 51 days will add 2k-3k to the death toll (this mean >100k lives irretrievably lost before Inauguration Day and vaccine public availability) – an avoidable and unforgivably tragic chapter in American history. 

COVID-19 Survival Rates Have Improved?

Amidst the bad news of COVID-19 increasing in the USA for the third time to record levels, there is some evidence that the case fatality rate (CFR = deaths/cases) has improved significantly from spring to summer.  Two large studies of patients in NYC and in England both show significant improvement in survival rates.  We have done a study of cases in Florida and find a similar trend in improvement. 

The figure above shows that cases (brown squares) in Florida first increased in March and then eased in June, only to surge again and burn out by early October.  Since then cases have risen again for the third time and deaths (blue diamonds) appear to have bottomed out and are increasing again.  During the first wave, the first 82,719 cases reported in FL on 6/17/20 were responsible for most of the 3702 cumulative deaths reported on 7/4/20.  This corresponded to an overall CFR of 4.5% (with deaths lagging cases by 2-3 weeks.  The second wave ended roughly on 10/20/20 with 676k more cases which lead to 13.8k more deaths that were mostly reported by 11/14/20.  This corresponds to an overall CFR of 2.0%, roughly a factor of 2 improvement from spring to summer.  The lag time between cases and deaths (as the reported date shown above) increased to 3-4 weeks as reporting lags increased in Florida (real lag time remains about 2-3 weeks). Notice that the scale on the right for deaths is 2% of the scale on the left for cases.  This is what we are predicting for the CFR for the third wave in FL.  A similar pattern is seen in the data for the USA as a whole where the CFR has improved from 6.7% to 1.5% currently. 

The strongest driver of CFR is age and the second wave was caused by many younger adults increasing their activity and getting infected.  We need to check how much a younger median age played into this observed improvement. 

The figure above shows that the improvement from wave 1 to wave 2 is remarkably similar for all age groups.  For example for adults between the ages of 65-74, 12.7% died in the first wave while only 5.5% died in the second wave.  Much of this improvement can be attributed to wider testing (identifying milder cases and cases earlier in their cycle), better hospital practices (e.g. proning rather than immediate ventilating), and better therapeutics (remdesivir and dexamethasone).  A newly approved monoclonal antibody, bamlanivimab, could improve this further. 

One note of caution is that FL and the USA are just approaching the low CFR levels seen in South Korea and other best-in-class countries all along suggesting that much of the improvement is due to the UK and USA finally getting their act together in terms of testing and treatment.  In the spring, USA and UK undertested and missed many asymptomatic and mildly symptomatic cases, and many hospitals were overwhelmed so only the most seriously ill were admitted who then died at a high rate.  Some of the improvements in survival rates could be reversed if hospitals become overwhelmed with equipment and staff shortages in this ferocious third wave. 

COVID-19 Cases in the USA are Rising for the Third Time

The total number of COVID-19 cases in the USA surpassed ten million or 3% of the population today.  The third wave of the Pandemic in the USA is here and it looks extremely dangerous.  For the first time, the number of confirmed cases per week has reached 700,000 or more than 100,000 per day – 50% higher than the peak of the summer wave reached in July (see brown squares in the figure below).  Cases are rising everywhere this time around in contrast to the first wave which was concentrated in the Northeast and the second wave that was concentrated in the Sunbelt. 

This third wave differs significantly from the first and modestly from the second in other ways.  Testing now is much more thorough than the first wave and slightly better than the second wave thus identifying more asymptomatic and mildly symptomatic cases than before (see figure below).  More kids and young adults are being tested now increasing the percentage of silent carriers.  

But the new cases are not all benign as new hospitalizations, albeit with a longer lag time and lower hospitalization ratio have risen steadily since 9/20 (see blue diamonds in the first figure above).  During the first wave patients were so sick they were hospitalized within a few days of diagnosis.  During the second wave, the lag time increased to about a week and those requiring hospitalization decreased by half.  The lag time now appears to be 2 weeks.  Given the rapid increase in case counts, we are forecasting that hospitalizations (currently near 55,000) will exceed the previous peaks of 60,000 by next week and set new records that will stress many hospital systems just a week or two before Thanksgiving. 

Even though hospitals are better prepared this time around with PPE, ventilators, improved treatment techniques (proning), and better therapeutics (Remdesivir, dexamethasone, and monoclonal antibodies), they could still be stressed and cause death rates to exceed those reached this past summer and challenge the horrific levels reached this past spring.  Better medicine plus wider testing and lower median ages had reduced the hospitalization ratio and improved the case fatality rate (CFR) from near 7% to 1.6%. But these favorable factors may be offset by new stresses on the healthcare system.  Deaths rates have already been creeping up since bottoming near 720 per day on 10/17 to near 950 per day (see blue diamonds in the figure below).  We are forecasting that the death rate will double to 1,440 per day by month-end.  The news could get substantially worse if nothing is done immediately.     

Now that the election has passed, the USA must depoliticize the war against COVID-19 and work together to flatten the curve to save lives.  To avoid the worst-case scenarios, pandemic fatigued individuals must agree to wear masks, social distance, and wash hands as recommended by the CDC.  The government must increase testing availability and turnaround times, improve contact tracing, and set up selective quarantining facilities to monitor and reduce community spread.  The Federal government must coordinate equipment acquisition and distribution to ensure no shortages occur this time around.  The next 74 days are crucial if we want to ensure that the case count does not more than double with another 10 million cases and the death count does not increase by more than another 160,000 Americans. 

COVID-19 Cases in Florida are Rising for the Third Time

COVID-19 cases are increasing around the world, in the USA, and in Florida.  In Florida, cases have been rising for the last 5 weeks albeit at a slower rate than many northern states as temperatures have cooled and activities have moved indoors slowly in the Sunshine State.  In Florida, the push to reopen the economy and especially schools have exacerbated the problem.  Since schools have reopened in August it is clear that kids can get infected and high school kids are as likely to get infected as the general population (see graph below). 

College kids and young adults are nearly twice as likely to get infected since they are more mobile and are less risk-averse in general.  While younger kids appear to be less contagious than older kids, their infection rates have been going up with the general population and for kids of elementary school age (5 – 10) it is now about 45% that of the average population.  Even though kids (<18 yrs old) are unlikely to die from COVID-19 (in fact none have died in the last month), a significant portion does get sick.  107 out of 10.7k kids (<18), or 1.0%, have been hospitalized in the last month.  69 FL kids (<18) have been diagnosed with multisystem inflammatory syndrome for children (MIS-C) so far this year.  Perhaps more concerning is that the asymptomatic or mildly symptomatic cases go on to silently infect others (parents, grandparents, and teachers) – increasing the hospitalization and death toll in the community.  We are beginning to see this in the recent increase in the median age of those infected from a low of 35 years old touched at the beginning of September to 39 recently (see figure below).  A similar transfer from young to old occurred this past summer and led to a record surge in deaths.   

This shift to the older generation has resulted in a 24% increase in currently hospitalized from a low of 2,005 reached 10/18 to 2,489 on 11/4 (see figure below).   

Death counts are currently near a 4-month low near 40 cases per day (see figure below).  However, the increased case counts and hospitalizations have led us to forecast death counts will increase soon for the third time this year.   All this happening before the start of the truly cold weather season bode ill for Florida in the coming months. 

Powered by WordPress & Theme by Anders Norén