Quantitative analyses on the global coronavirus pandemic

Month: August 2021

Some Governors Are Endangering Kids and Prolonging the Pandemic

Many governors in the USA are insisting that they cannot mandate vaccines or mask usage (as in GA), or are actively obstructing localities that try to do so (FL and TX).  Their claims rely on rampant misinformation that kids do not get COVID-19 – or that if they do, they get very mild cases and do not spread it easily, and rarely do they die from it.  This was questionable earlier this year with the initial variants and has become very misleading in the last two months as the extremely contagious and ferocious Delta variant has spread to constitute 99% of all cases in the USA. 

It is increasingly clear that the Delta can and does seriously infect school children, especially those under 12 who cannot be vaccinated yet.  Recent anecdotal stories from Florida have raised alarm and now strong statistical evidence has emerged that reopening schools without mitigation measures may be extremely dangerous to the health and futures of millions of kids while also encouraging the continued spread of the SARS-CoV-2 among all Americans. 

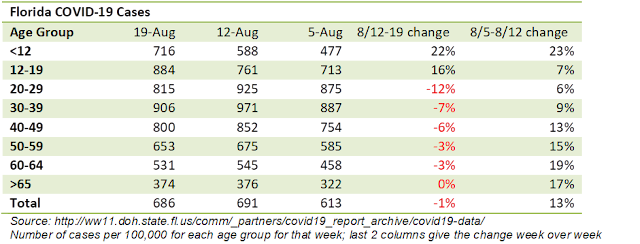
The table below from the Florida Department of Health (FL-DOH) weekly report captures the case trend by age group in FL over the period of 7/29 – 8/19, a period when many schools began to reopen in FL.  Columns 2-4 show the weekly case counts per 100,000 people for the weeks ending in 8/19, 8/12, and 8/5.  These are all extremely high although the over 65 group is below average due to their well-vaccinated status (85%).  The last two columns show the percent change from week to week.  As expected cases were still soaring in the period from 8/5 – 8/12 for every age group with as high as a 23% increase for the under 12 age group.  With schools reopening the virus has continued to surge for that age group – up by 22% for the week 8/12 – 8/19.  Middle school and high school student infections grew by 16%.  Interestingly, this wave appears to have peaked for everyone else.  This is somewhat expected since Delta surges are extremely contagious and fast-growing but they also tend to burn out rapidly after reaching a peak infection of about 100 per 100,000 per day.  At this stage, exponential growth stops as it did in the UK. 

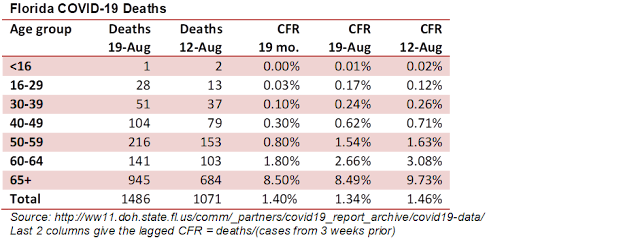
What about the more dangerous outcome of Delta – how fatal is it?  The answer is slowly beginning to emerge as deaths take 2-4 weeks after infection to resolve and then several more weeks to be reported.  The following table from FL-DOH shows that the case fatality rate (CFR = deaths/cases) from COVID-19 is highly age-sensitive with a CFR about 100 times higher for the oldest group (>65 yrs old) than the younger groups (<30 yrs old) over the 19-month span of the pandemic in Florida (column 4).  However, the strong age dependence has evolved with the arrival of Delta.  Death counts and death rates have increased for all age groups but most significantly for the young.  For those age16-29 years old, the lagged CFR [=deaths/(cases from 3 weeks prior)] has increased from 0.03% to 0.17%, or nearly 6-fold.  For middle-aged adults 30-49 years old, it has more than doubled.  Overall CFR has remained near the life-to-date value of 1.4%.  We need to accumulate more data to ascertain how much deadlier the Delta is than the original and earlier variants.  As more people get vaccinated, we expect the CFR to improve.  Unvaccinated kids and young adults will remain big carriers of the disease unless schools adopt stronger mitigation measures and they will also serve to lower the overall CFR.

This early data makes it clear that Florida’s current wave could have peaked already if the governor had not poured more fuel -misleading information – on the fire and supplied more kindling – kids.  Moreover, kids are much more likely to die from Delta than from the original SARS-CoV-2.  Along with the uncertain but potentially debilitating effects of Long-COVID, this makes the Delta variant a major threat not only to the wellbeing of millions of children but also to every Floridian.  Prolonging the contagion increases the possibility of even more dangerous variants developing in millions of Americans that continue to be infected each week.  

COVID-19 Death Counts Reporting in FL Gets Less Transparent

The Florida Department of Health (FL-DOH) convinced the CDC to accept an alternative method for reporting COVID-19 cases and deaths this week that made things less transparent and more confusing at a critical junction of the pandemic.  The FL-DOH has done well in tracking actual and reported dates for deaths and cases but now it has switched the two up in its reporting to the CDC and the public.  The CDC appears to have accepted the new actual date reporting from FL without questions or explanations while most of the other 49 states are still sending the CDC “as reported date” information.  At the end of the day, the two data series wind up in the same place because cumulative cases and deaths must total to the same numbers at all times, but in the interim, there is the potential for misleading conclusions and bad policies. 

report dateCum casecalc diffpre wk casecum deathcalc diffpre wk deaths
12-Aug      2,877,214      151,764      151,415      40,766      1,071       286
5-Aug      2,725,450      134,751      134,506      39,695       616       175
29-Jul      2,590,699      110,724      110,477      39,079       409       108
22-Jul      2,479,975        73,166        73,199      38,670       282         78
15-Jul      2,406,809        45,449        45,604      38,388       231         59
8-Jul      2,361,360        23,747        23,697      38,157       172         32
1-Jul      2,337,613        15,684        15,978      37,985       213         48
25-Jun      2,321,929        11,048        11,873      37,772       217         44
18-Jun      2,310,881        10,095        10,629      37,555       290         43
11-Jun      2,300,786        12,157      37,265         40

Source: The bold numbers are those reported by the FL-DOH (http://ww11.doh.state.fl.us/comm/_partners/covid19_report_archive/covid19-data/)

By going to the actual date of occurrence reporting, data for the previous days are continually updated in a non-transparent way.  For example, the weekly FL-DOH report says the previous week’s deaths total 286 for the week ending August 12th (row 2, column 7 in table above).  But the week’s total deaths can also be calculated by subtracting the previous week’s cumulative total (39,695) from the current week’s cumulative total (40,766) to get 1,071 additional deaths reported for the week ending in August 12th.  The FL-DOH’s 286 is the actual number of people who died during that week AND were reported for that week, but this number needs to be continually adjusted as deaths sometimes take 2 months to verify in FL.  Eventually, the 286 will grow to 1,000 – 1,100 as late death reports drift in.  Similarly for FL-DOH to say the death count is 29 for August 12th (see last red dot on the graph below) may be technically correct but extremely misleading.  Deaths in FL have not gone down over the last two weeks but are in reality rising.  Every day this 29 number will grow but the growth may be concealed from public view.  Without proper explanation, the public will be misled to draw the wrong conclusion about how to slow or end the pandemic.  

The green curve would cause citizens and their government to become more alarmed and more vigilant about adopting sensible mitigation measures such as vaccines, masks, and social distancing.  Rising cases and hospitalizations should have already convinced citizens to do the right thing, but many still argue that until cases result in death they are not concerned.  The red curve might lead the casual observer to say things are not so bad and the government to say that further mitigations are not necessary.  Because pandemics grow exponentially fast, every day’s delay in action now can result in hundreds of dead Floridians. 

The problem is not confined to Florida because Florida has accounted for up to 20% of all US cases and still accounts for 20% of all US hospitalizations, it has an outsized effect on total US numbers.  The declining death count in FL would soften the rising death count seen in every other state in the union, causing the CDC and the US government to adopt bad public health policies.  It could lead other states such as Texas to say “if FL can do nothing and in fact still obstruct public health policies and do well maybe we can do the same thing”.  Texas COVID-19 cases, hospitalizations, and deaths are soaring.   Worse, they may adopt this Florida method of suppressing recent death counts and make themselves look better.   (Something funky happened in California this week but it seemed to have been a one-time restatement; their death counts have resumed rising.)  So we humbly request that the CDC reconsider this change and make Florida report deaths in the same way as every other state which would allow Americans and scientists access to the latest information in the most transparent and uniform fsdhion – otherwise, they must carefully explain why the entire data series needs to be downloaded every day and preserved to get the full picture 

COVID-19 Death Counts in the USA are Rising

President Biden and the CDC are hoping that the US COVID-19 death rate will be better for this current surge.  We are optimistic but have doubts.  The reasons are complex.  For one, the US continues to test much less thoroughly than other best-in-class countries such as the UK.  Thorough testing can identify and stop outbreaks before they become serious surges.  Moreover, identifying a higher number of asymptomatic and mild cases causes the measured case fatality rate (CFR = deaths/cases) to improve since the denominator increases and the ratio decreases. 

In the UK, the CFR appears to have improved significantly from 2.1% for the last wave in January to 0.3% for the current Delta surge.  Part of the reason for the improvement is that the majority of Brits were vaccinated in early 2021 and the death rate for the vaccinated is much lower than for the unvaccinated. 

The US hopes that a similar improvement will be observed.  Unfortunately, this appears to be unlikely for a number of reasons.

1.     The vaccination rate has been slower and lower in the US than in the UK.

2.     The positivity rate is much higher in the US (~9%) than in the UK where it has stayed below 4% throughout this last surge.

3.     The hospitalization rate in the US has already begun to soar. 

4.     The CFR has shown little improvement in the US this year. 

This last point is crucial since it is the best predictor of deaths to come from cases and hospitalizations already in the pipeline.  Lagged CFR is calculated by dividing the average deaths for the past 7 days by a weighted average of cases for the previous 2 – 4 weeks.  Deaths usually take up to 20 days to resolve from case identification.  Then some jurisdictions take up to 2 months additional to report those deaths.  The graph below shows that after the initial confusion in early 2020, CFR improved dramatically and then stabilized around 1.5% for most of 2021.  The fact that it hasn’t improved over the last 12 months is rather disappointing.  It suggests that testing, tracking, and treatment of COVID-19 cases in the US has not improved in that time. 

In recent weeks the CFR has actually deteriorated due to the very contagious and possibly more lethal Delta variant catching an unprepared American population.  We expect the CFR to improve through the rest of the year for an unfortunate reason: the increasing prevalence of breakthrough cases as the effectiveness of vaccines begins to wane.  Since breakthrough cases are more likely to be mild, only a fraction ~0.4% will result in deaths. As more and more people get vaccinated the CFR could drop to the 0.3% seen in the UK.  We can only hope this happens soon.  In the meantime get the vaccine if you haven’t yet, get the booster if your last shot was more than 6 months ago, and wear a mask and social distance as much as you can.  

COVID-19 Breakthrough Deaths are NOT Rare

The Delta variant of COVID-19 is a very contagious and virulent beast.  When better data is required to understand this rapidly evolving virus CDC tracking of COVID-19 cases has gotten worse.  For breakthrough cases due to the Delta variant, only the bare minimum is available.  Nevertheless, they do track total cumulative weekly hospitalizations and deaths in the US (with many caveats).  These data allow us to track incremental weekly data by subtracting the previous cumulative total from the current week’s cumulative total.  The trend is disturbing.

Week EndingCum BK HospitalCum BK Deaths7-day BK Hosp7-day BK Deaths7-day total Hospital7-day total Deaths% of hosp% of deaths
8/2  7,101  1,507    862     244  10,000    2,868   8.5%    8.5%
7/26  6,239  1,263    325     122    6,000    2,133   5.4%    5.7%
7/19  5,914  1,141    725       78    9,000    1,978   8.1%    3.9%
7/12  5,189  1,063      
7/19-8/2   1,912     444   25,000    6,979   7.6%    6.4%

Source: CDC (https://www.cdc.gov/vaccines/covid-19/health-departments/breakthrough-cases.html

Cumulative breakthrough hospitalizations (column 2 in Table above) and cumulative breakthrough deaths (column 3) in the table above are not very useful for analysis since they cover a long period of time when there were only a few fully vaccinated Americans and few Delta variant cases.  For the original and early variants, the mRNA vaccines were extremely effective against infections and near 95% effective against hospitalizations and deaths.  But the Delta variant is much more contagious and possibly more virulent.  Given this uncertainty, it is very important to track how the Delta variant behaves against vaccinated and unvaccinated Americans.  The most recent CDC data releases allow us to do this for the total US.  Columns 4 and 5 give us the 7-day totals for breakthrough hospitalizations and deaths, respectively.  These weekly totals were small and formed a small percentage of the total US numbers until 5 weeks ago when Delta cases started to soar in the US.  Overall breakthrough hospitalizations and deaths began to soar 4 weeks ago.  Over the 3-week period from 7/12 to 8/2, 6.4% of all deaths were breakthroughs (column 9) and an estimated 7.6% of all hospitalizations were breakthroughs (column 8)in the US.  This is happening at a time when about half the US (49.6% as of 8/2) was fully vaccinated and about 83% of all COVID-19 cases were Delta (as of 8/2).  If the mRNA vaccine is 90% effective against death and if the same number of unvaccinated and vaccinated Americans were exposed to SAR-CoV-2 Delta over this time period we would expect only 5% of all deaths to be breakthroughs.  The fact that it is now above 5% is quite troubling.  All else being equal – a necessary assumption in the absence of disaggregated data – 8.5% breakthrough deaths last week implies vaccine effectiveness of 83% against COVID-19 deaths. One factor that may make this ratio high is whether other mitigation factors were employed by the unvaccinated such as consistent mask-wearing or social distancing that lowered the infection rate for this group.  If masks turn out to offer better protection than the vaccine against Delta infection then more unmasked vaccinated people would get infected increasing breakthrough deaths.

Furthermore, the trend has been worsening.  As Delta cases approach 100% of all cases we expect these breakthrough deaths to increase. Of course, as more Americans get vaccinated, the percentage will increase even further toward 100%.  Currently increasing percentages might mean that the protectiveness of the full vaccine may be losing efficacy.  Both Pfizer and Moderna have sought authorization to administer booster shots but the FDA and the CDC are balking, possibly for political and messaging reasons.  This is absolutely unacceptable, particularly for the immunocompromised.  Israel has now authorized booster shots, and they track variants and breakthroughs better than the CDC.  The FDA should also give full approval for the vaccines instead of dragging its feet.  The CDC must begin to track breakthrough cases with more timeliness and more detailed segmentation.  They should view this outbreak as a new spike that requires thorough study and vigilance – testing, tracking, and applying the full arsenal of mitigation measures. Loosening the mask guidance on May 15th was dangerous.   Declaring victory against COVID-19 on July 4th was premature.  Calling this a pandemic of the unvaccinated is an oversimplification that leads to incorrect behavior.

Every American must mask up to reduce infections, vax up to save lives.  

Powered by WordPress & Theme by Anders Norén