Quantitative analyses on the global coronavirus pandemic

Month: September 2021

Serious Breakthrough COVID-19 Cases Are Not Rare

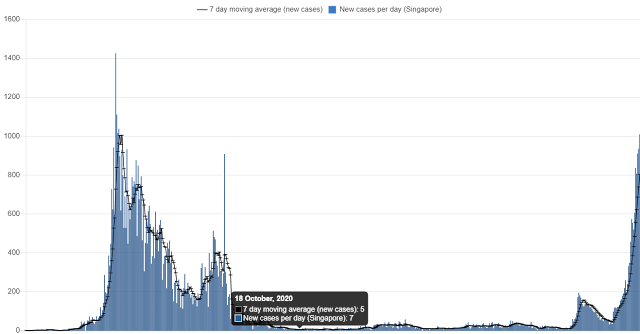
We had warned two months ago that the CDC had erred in dropping the tracking of COVID-19 breakthrough cases and not doing more to track serious breakthrough cases with more detail.  This has led to tremendous confusion and bickering among the White House, the CDC, and the FDA regarding the need and timeline for rolling out vaccine boosters.  Somehow the FDA decided to ignore a lot of good data from the UK, Israel, Iceland, and Singapore regarding the seriousness of breakthroughs.  Now the CDC is leaning toward quicker and broader booster rollout.  Why?

One reason is that yesterday, the CDC reported a big jump in breakout hospitalizations and deaths due primarily to the addition of one more state in their weekly report.  Based on the trend over the last 10 weeks, everyone had expected 3,400 cumulative breakthrough deaths to be reported yesterday (red curve in graph above and table below).  That they got 4,493 was probably a huge shock.  It meant that the total breakthrough deaths over the last 10 weeks were ~3,300, 37% higher than the 2,400 they had expected.  This meant that the USA had 37% more breakthrough deaths due to the Delta and vaccines waning than they had thought just two days earlier.  The graph above shows how the new cumulative breakthrough death curve (blue) might look like had all 50 states and territories reported consistently all along.

How could this happen?  One state probably just acknowledged that they had 1,060 breakthrough deaths that they had not counted/reported before this week and that every week’s breakthrough deaths for the USA over the last 10 weeks had been understated by ~28% and breakthrough hospitalizations by ~15%. On July 12, the CDC breakthrough death count should have been ~1,200 rather than ~1,063, and on 9/20 it had grown to 4,493 due to a very virulent Delta variant. 

That this included a large historical restatement does not make it any less significant for the CDC or the USA – it is equivalent to NY finding out that they had undercounted the number of nursing home deaths due to COVID-19 last spring and had to make a data dump to correct.  It means that the prior CDC narrative that breakthrough deaths are rare is wrong and is far more likely than they had thought.  Rather than admit that they had mismanaged data again (for the nth time), Dr. Walensky decided to broaden booster usage on her own yesterday – mystifying thousands of scientists and reporters.  The truth is the USA needs boosters to stem the current surge almost as much as they need to vaccinate more people. 

Week EndingCum BK HospCum BK Deaths7-day BK Hosp7-day BK Deaths
20-Sep 19,1364,4933,346 1,453
13-Sep15,7903,0401,675    365
6-Sep14,1152,6751,207    238
30-Aug12,9082,4371,858     374
23-Aug11,0502,0631,334     234
16-Aug 9,7161,8291,662 242
9-Aug 8,0541,587   529        80
2-Aug 7,5251,507   938     244
26-Jul 6,5871,263   627      122
19-Jul 5,9601,141   740        78
12-Jul 5,2201,063  
7/19-9/20 totals 13,916  3,430
Source: https://www.cdc.gov/vaccines/covid-19/health-departments/breakthrough-cases.html

Russia vs. USA – Which is Faring Better in the Pandemic?

Russians headed to polling stations across the country this past weekend to vote in a totally new lower house of parliament.  Despite very little notice in the West COVID-19 is a driving factor in the elections and for a good reason.  The Delta variant is hitting Russia very hard. 

For much of 2020, Russia claimed they had a good handle on the global pandemic and while they saw surges in cases, they reported better than average case fatality rates (CFR) of 1.6% for most of the year.  Further, they claimed to have developed a vaccine, Sputnik V, that provided good protection against SARS-CoV-2 infections.  Mass distribution began in Dec 2020 near the same time as in the US.  Things worked out pretty well in early 2021 as cases and deaths dropped, but as the Delta variant began to spread in May 2021 a third and most deadly wave hit Russia. 

What went wrong?  Assuming that the COVID data from Russia is of average quality (big assumption), it seems that the Sputnik V vaccine is virtually useless against the Delta variant despite a claimed efficacy of 80% against hospitalization.  CFR more than doubled over the last 6 months to 3.8% – one of the worst in the world even among countries that were totally exposed and unvaccinated.  This is 10X worse than Japan’s experience with DeltaCOVID stats from Russia are highly suspect, so the real toll could be 28% higher vs. 20% higher for the USA.  COVID-19 could be inflicting tremendous pain on Russians.  Moreover, in recent weeks, cases rose again after falling for nearly 3 months as schools reopened in September in Russia with no masks or social distancing. 

Russia’s death/day/1M capita is near 6 – nearly the same as the USA.  Russia’s problem may be a rushed and ineffective vaccine.  What is the USA’s excuse for such a high death count and poor performance when we have some of the best vaccines in the world?  Superior western science has given Americans a solution that demagoguery is rejecting.  Is Russia’s state-managed science worse than America’s state-mangled science?

Florida is Misusing Expensive Monoclonal Antibodies

Why has Governor DeSantis spent so much time since early August pitching $2,100 Monoclonal Antibodies (MAB) as his solution for the pandemic when there are cheaper and more effective solutions such as $20 vaccines and $0.20 masks that have been used by a thousand times more people safely to reduce SARS-Cov-2 infections and deaths?  MAB does have a very useful purpose: they serve to help high-risk patients who have been infected as a second line of defense; they are expensive and should not be given as frontline defense until cheaper and more durable versions are made.   

The original reason seemed to be that Governor DeSantis wanted to do his biggest donor a favor.  But now that the country has run out of Regeneron MAB and everything is back-ordered, and states are on allocation, he continues to complain and push a false and dangerous narrative.  Does he really think that he is fighting for the average Floridian by doing this?  Today he boasted that since he has been promoting MAB Florida has given out 100,000 MAB doses at a cost of $210M to the Federal government.  He claims that hospital admissions have been reduced by 60%.  True statements but one have nothing to do with the other.  Adult hospital admissions (red curve in the figure below) have historically shown a strong correlation with total cases (blue) especially over the last 8 months: about 10% confirmed COVID-19 cases result in hospitalizations.  The data has continued to show the same high correlation over the last 6 weeks that he has been pushing MAB. 

There was a brief three-week period associated with school reopening when the number of kids 19 and younger constituted more than 30% of all cases and caused the total number of cases to blip up.  But since then the two curves resumed matching each other very closely.  If MAB had a real beneficial effect one would expect the red curve to drop significantly below the blue curve.  The reason that this has not happened is that there was no requirement for MAB users to have tested positive for COVID-19; they received MAB on the basis of a self-claimed exposure to COVID-19.  There was also no requirement to show proof of vaccination, or a doctor’s prescription to prove that the person is a high-risk patient.  This allowed many Floridians to use MAB as a substitute for vaccination.  This is totally wrong.

There are 10M Americans who are immunocompromised.  Most of them have been vaccinated and many of them have received a third shot.  Yet a significant percentage of them have not gotten strong protection from the vaccines due to their weakened immune system.  For millions of these people masking and isolation is a fact of life.  Unfortunately, many of them get COVID-19 nevertheless.  It is believed that many of the 10,000 breakthrough hospitalizations over the last 8 weeks are associated with this immunocompromised population and older people who generally have weakened immune systems.  100,000 breakthrough cases associated with the 10,000 hospitalizations (using the 10:1 ratio of cases to hospitalizations found above) could have used the MAB and could have been spared a trip to the hospital.  Instead, Governor DeSantis deprived them of their only path to safety and allowed unvaccinated and low-risk people to use up the available supply of MAB.  I take this insult personally because I am one of the 10M immunocompromised Americans who may now have to wait for supply to catch up with demand or die in the interim. 

Taiwan, Singapore and Japan – 3 Different Delta Fates

For the first 15mo of the global pandemic, many analysts had held up Taiwan as an exemplar for how to handle a pandemic.  They had experienced only a few hundred well-monitored cases and only 7 deaths from COVID-19 for 15 months.  During this same period, Singapore also did very well.  They weren’t able to avoid infections with a high number of guest workers in a fast-growing City-State but they kept their case fatality rate low (CFR = 0.06%) due to a young population and a good healthcare system.  Japan, being a larger country with many International ties experienced all the travails of the global pandemic in 4 waves matching more or less those of the USA and the rest of the world.  They had a CFR that was near 2% – quite good for a population with high median age.  The fates of the 3 have diverged dramatically with the arrival of the Delta variant this Spring. 

Taiwan’s island nation status allowed them to isolate themselves from the storm raging outside in 2020.  Then they relaxed their vigilance and allowed a few airline personnel to come into contact with Delta and then they rapidly lost control.  Moreover, they got too complacent and did not push vaccinations very hard so much of the country was unvaccinated when Delta hit and Delta hit hard.  The CFR for Taiwan for Delta is a horrendous 5.3% – a tribute to the contagiousness and virulence of the Delta and a sign of how unprepared Taiwan really was to fight a serious pandemic. 

In Singapore, they were able to fend against Delta fairly well until just 2 months ago – then Delta hit hard.  Cases soared and now deaths are soaring as well. The CFR appears to be 0.3% or 5 times worse than prior but could well be 10X worse when this infection wave passes.  Curiously Singapore is one of the better-vaccinated countries in the world so that many of these cases and deaths must be breakthroughs.    

Finally, for Japan their Delta invasion came coincident with the Olympics.  Cases edged up in the weeks before the Olympics start as athletes arrived to prep for the Olympics and peaked within 10 days after the end of the Olympics.  At the peak, cases were nearly 3 times higher than for any prior peak.  However, it looks like CFR will be just 0.32% for this fifth wave.  How did Japan manage to do better against the Delta than prior variants when they had experienced CFR = 2.0% in wave #4?  One possible answer is that the median age of infectees had dropped for the Olympics.  Japan was just beginning to vaccinate its people and it started with the older, more vulnerable part of the population who were by nature more cautious and masked or stayed home.  The real answer may not be known for a few more months, though.

Against the Delta, the good turned in poor performances and the bad turned in better performances.  The Delta variant continues to confound scientists and governments.   Some are saying that if a highly vaccinated and masked Singapore can experience a Delta surge – no country is safe. The most prudent approach is to assume that with the Delta we are dealing with an entirely new contagion that requires high vigilance and much more study.  

Save Our Children From The Ravages Of COVID-19

The COVID-19 pandemic had been relatively mild for children in 2020.  In the early days, schools were shut and kids were sent home to learn remotely.  Later when people found out kids were not as susceptible to serious illness from SARS-CoV-2, schools reopened and in-person learning was slowly restored with strong mitigation measures instituted.  Pediatric hospitalizations (red curve in the figure below) increased last Fall but not too badly –running near 1.2% of adult hospitalization at the peak around the New Year.  Late Spring 2021 with Delta edging onto the scene it became obvious that kids were more susceptible to this more contagious and possibly more virulent variant.  Epidemiologists warned that school reopening without strong mitigation measures could lead to disaster and yet ironically more governors and parents went the opposite direction and eased mitigations.  The end result is that pediatric hospitals were swamped and more kids suffered needlessly with MIS-C and other long COVID illnesses as pediatric hospitalizations are now at record levels = 2.4% adult hospitalizations.     

Why do we say needlessly?  Because there are now proven mitigation measures that could have reduced the toll.  Kids 12 and over and all staff could and should have been vaccinated.  All kids and school personnel should have masked up indoors.  Improved ventilation techniques such as HEPA filters could have been applied.  Rapid testing could have been given to kids on a regular basis, especially those without access to vaccines.  Even adopting some of these measures would have permitted in-person instruction to continue with minimal interruption.  As it was, schools tried to reopen without mitigation measures and were forced to close or quarantine a large number of students – interrupting their education and producing a worse result than if they had just stayed with remote learning. 

Could all this have been avoided?  In California, schools reopened successfully with many of these mitigation measures in place.  The difference between Texas (red curve in the figure below) and Florida (blue) with obstructionist governors, and California (green) with a governor that follows the science is striking. 

Kids can return to in-person learning safely and stably.  Families with elderly grandparents or immunocompromised parents can breathe easier knowing their kids are safe and they won’t be bringing home the virus.  All it would take is for a governor to show true leadership and do his primary job of protecting the lives and livelihoods of his constituents.  

COVID-19 Reporting Issues – Bigger than FL and CDC

COVID-19 data tracking and reporting have been problematic from day 1.  Outdated systems and procedures made it difficult to understand the severity of the pandemic in its early days and handicapped the US efforts to control it.  President Trump in a fit of pique and for political reasons decided to bypass the Center for Disease Control (CDC) for COVID-19 reporting and shift it to another department in Health and Human Services (HHS) on July 15th, 2000.  This has turned out poorly because while the CDC had problems, the HHS had no experience with tracking and reporting infectious diseases.  While this helped Trump in the short term politically because the HHS was more willing to alter the data to fit the President’s message it hurt the US pandemic response long term.  The President should have spent money on improving the existing CDC system instead of building another parallel system to monitor COVID-19. 

Have things improved in 2021?  The recent miscues in reporting cases and deaths from the Florida Department of Health (FL-DOH) to the CDC say no.  It turns out that there is another way that FL COVID-19 deaths were tracked by the HHS on its HealthData.gov website.  Since July 2020, HHS has compiled COVID-19 deaths as reported by all the hospitals in the USA.  In its early days it was incomplete – possibly because many COVID-19 deaths occurred outside of hospitals – in nursing homes, prisons, private homes, etc.  But for the current wave, HHS has been tracking FL deaths better.  HHS (red curve in the graph below) appears to tracks about 90% of all deaths compared to the blue curve which tracks deaths on an actual date basis as now reported to the CDC.  It tracks quicker with just 2-3 days delay from the actual date of death – unlike the green curve which counts deaths as actually reported but delayed by 2 weeks of massaging (formerly reported by the FL-DOH to the CDC).  It tracks the actual shape of the growth in death that cursory examination of the blue curve would distort.  So if the Governor of Florida was trying to manage the narrative he forgot that the HHS death time series would have undercut that story – deaths are really soaring in FL as they are in TX, GA, and most other states.   

So is the HHS system better than the HHS system?  No, because while it has the best hospitalization data its data on COVID-19 cases and deaths are incomplete. We had actually begun this study to see whether there were as many deaths occurring outside of the hospital system as there had been in prior waves.  The fact that there haven’t been is somewhat surprising (perhaps due to the ferocity of Delta), but does not obviate the need for the more complete count done by the CDC.  Even that could be improved since substantial evidence exists that deaths in excess of what is normally expected every year have occurred above and beyond what the CDC has counted as confirmed and suspected COVID-19 deaths. 

The USA should be investing in a single centralized data system that captures accurate, timely, and consistent infectious disease data from all states.  Data validation systems (using A/I and machine learning) can identify attempts to pass inconsistent or incomplete data so that only clean data is presented to the public and given to scientists for detailed analysis.  CDC should provide state-of-the-art data extraction and reporting tools for that one system instead of building two expensive half-baked systems.  Trying to manipulate or manage the data will ultimately be futile creating short-term confusion and long-term distrust of data and science and the government.   

Delta Variant is More Contagious And Appears to be More Virulent

Many studies have now shown that the Delta variant is about 2.3x more contagious than the original SARS-Cov-2.  Some people suspect that it could also be more deadly but there is no clear evidence for this.  Much anecdotal evidence points to there being more young adults and kids being seriously ill and hospitalized during the latest Delta wave.  But are there more people hospitalized and dying from Delta than before? 

Are cases resulting in more hospitalizations?  For the period before 6/1/21, 8.1% of all COVID-19 cases in Florida (FL) required hospitalization (CHR = Hospitalizations/Cases).  For the last 100 days when Delta began to dominate, 9.3% of all cases resulted in hospitalizations.  You may have noticed in the graph below that this trend that had brought the hospitalization rate briefly over 10% (note that the hospitalization rates are scaled at 1/10th the scale of cases) has reversed over the last 3 weeks. 

The reason for this is that since schools reopened more pediatric cases have been identified and even though they do get hospitalized they do so at a much lower rate than older adults.  This tends to drag the overall CHR lower.  We used to be able to calculate CHR by age but since FL went to weekly reporting with far less detail it has been difficult to get CHR by age.  An alternative is to measure total new hospitalizations/capita/year versus age.  Delta produces higher hospitalization rates because it spreads faster and when it does infect, it produces more hospitalizations for most groups biased toward the younger (red curve below). Furthermore, if we adjust for vaccination status (~10% for the period covered by the blue curve and 50% for the period covered by the red curve) the danger of the Delta variant is even more pronounced. 

Another way to look at the severity issue is to calculate the lagged Case Fatality Rate [CFR = deaths/(cases 3 weeks prior)].  The curve below shows a marked increase in CFR to near 2.0% from a 2021 average of 1.3% beginning in June with an apparent drop-off in August.  Recently it has moved back up to near 1.6%.  This is surprising given that the median age of confirmed cases has dropped due to kids being infected from schools reopening dangerously.  Moreover, we would expect CFR to drop over time as more people get vaccinated since the CFR for vaccinated people is expected to be lower and even lower still for those boosted (this is what is observed in the UK and Israel). 

The age effect for CFR is very strong with older people much more susceptible to deaths than younger folks.  This can be seen in the graph below where CFR by age for the life of the pandemic in FL is shown in blue.  Similar data for all deaths reported during the 5 week period from 8/5-9/9 is shown in red.  You can see that the red curve is higher for all age groups under 65 years old.  This seems to suggest that the Delta variant is more deadly.  The 65+ age group is far better vaccinated (87%) than any others in FL so a higher percentage of these deaths are probably breakthroughs with lower CFR than for unvaccinated of the same age. 

Given that all this data suggest that the Delta variant is more contagious AND more virulent, especially for innocent kids, we need more accurate, timely, and consistent information from all the states, the CDC, and HHS – not less.  It should be criminal to withhold such data from the public, the President, and the scientists who are desperately trying to understand SARS-CoV-2 better so we can control the pandemic.  

Florida’s COVID-19 Reporting Change Has Major Consequences

Our blog post about the major change in Florida’s COVID-19 reporting to the CDC has developed into a national story with partisan biases.  A couple of days ago the Miami-Herald “broke” a news story that claimed Florida changed its COVID-19 data recently – something that I had worked with a Sun-Sentinel reporter to break 18 days prior.  Now the story has been picked up by MSNBC, the Wall Street Journal, and other national news services.  However, none of these stories have addressed the full impact of Florida changing COVID-19 cases and deaths from date of reporting to actual date of occurrence.   

1.     While technically correct the new FL method is only used by a few other states to report their deaths to the CDC.  Contrary to the WSJ article’s claim, TX is not using the FL method – or if TX is using the new method they only have a 1-2 day lag in recording deaths. The figures below show how CDC currently stores and displays FL and TX death counts.  As you can see FL death counts show a peak two weeks ago and a drop-off to near zero today.  While TX death count curve shows a steep rise to near-record highs.  The FL data for the last 4 weeks will be continually adjusted upward over the next 4 weeks – delaying accurate information for 4 weeks. 

2.     Allowing some states to report one way and other states to report a different way is a basic Data Science 101 error by the CDC.  You add apples to oranges and you get a meaningless fruit salad.  The CDC according to the WSJ has conceded that some states report the FL way and others such as TX report the traditional way. 

3.     Some states like CA are using actual dates reporting but because they update their data daily, databases and modelers can choose to use either time series in their models.  For FL, though, the wrong death count could be in the system for 7 days (eg. JHU still shows 43,979 as the total cumulative death that was reached and reported 6 days ago for FL). 

4.     If the CDC adds all the states up for the USA total, it distorts the picture of USA death counts and confuses the public and data scientists trying to forecast and advise POTUS.  FL accounts for ~20% of the US total deaths.  The new FL method understates deaths for the last 3-4 weeks which are used by many models to predict future death trends causing them to understate their forecast and causing POTUS to react too late.

Just as good military intelligence is essential for the conduct of a successful war – accurate, timely, and consistent information is essential for successfully winning the war on SARS-CoV-2.  USA intelligence on the COVID-19 pandemic had been poor and has not improved much this year.  Inadequate testing resulting in very high positivity rates, too little genomic testing to understand Delta’s contagiousness and ferocity, dropping breakthrough tracking just when vaccine efficacy may be waning, and switching reporting methodology and allowing states to drop daily reporting in the middle of a pandemic are just a few examples that could cause the USA to lose the war.  The CDC should set the standards for consistent daily reporting and help all states to achieve this.  Viruses do not respect state boundaries and the CDC should not let states dictate what information states give them.  When COVID19 cases are doubling as quickly as every 3 days in some jurisdictions earlier this summer, cases can grow a thousandfold in a month and quickly swamp hospitals causing unnecessary deaths.  Timely, accurate, and consistent information is key to making the right decisions to mitigate the spread and win the war.  

Two mRNA Vaccines Are Not the Same

In the early days of the COVID-19 mRNA vaccine rollout in the USA this year, vaccines were in short supply and people had no choice as to which vaccine to try.  Both two-dose vaccines from Pfizer and Moderna seems to have similar 95% efficacy against serious disease.  Recent studies are revealing significant differences between the Pfizer and Moderna vaccines. 

Moderna has nearly 3X the amount of active ingredients in Pfizer: 100mg vs 30mg.  Moderna created 2.6X more antibodies in patients than Pfizer – with both being negatively correlated with patient age and both declining exponentially over time.  The higher amount of initial antibodies allow Moderna to be more effective and durable against the Delta variant than Pfizer: the risk of a breakthrough case was 2X lower.  While Pfizer is recommending a booster 6 months after the second shot, Moderna is recommending a booster before this winter.  Moderna’s proposed booster has only 50 mg of active ingredients, but it is still proving to be highly effective in phase 2 clinical trials to date.   

As for side effects, a greater percentage of participants who received the Moderna vaccine reported reactogenicity: 82% vs 69% for Pfizer.  Many people (13%) taking Pfizer reported side effects with both doses that sidelined them for 1-2 days.  A small percentage (0.6%) reported symptoms severe enough to require a visit to the ER, and only 0.25% required hospitalization.  It is believed that serious side effects with Moderna are also <1%

If you are immunocompromised and probably did not get full protection from two shots – get your booster shot now unless you had severe side effects.  If you’ve had severe side effects after the second Moderna wait a few weeks for the 50 mg Moderna booster.  Otherwise, on September 20th, all Americans should be eligible for a booster shot.  Get it to improve your protection against severe COVID-19 illness.  Always mask up and social distance for additional layers of protection.     

Powered by WordPress & Theme by Anders Norén