The UK and California (CA) are two very different places with different demographics but they are now closely tied as having two of the hottest COVID-19 outbreaks in the world. The UK infection rate is currently at 0.73% of its total population over the last 2 weeks, second only to the USA at 0.86%, with CA leading at 1.48%.
Both the UK and CA have instituted masking and stay-at-home orders with varying degrees of compliance and success so it is actually somewhat surprising that these two regions got so hard hit. Masking compliance is 60% and 80% respectively in the UK and CA, and social distancing compliance is -30% and -40% respectively in the UK and CA. This bodes ill for other states and countries that have looser mitigation measures.
The UK’s high infection rate is apparently 80% due to the new variant (B.1.1.7) in the UK that contains the N501Y mutation (also seen in a South Africa variant). While this new variant does not cause more severe illness, it does spread more readily. This new variant has now been detected in 18 countries including the USA. This new variant has now been detected in Colorado but it has probably already spread in several other states. We suspect that many of the new cases in CA are also due to the new variant, although the USA has done very little detailed genetic testing. This deficiency coupled with the US government’s reluctance to enact a rigorous quarantine on UK travel to the USA leaves the USA highly vulnerable to this and future mutations of the SARS-Cov-2 virus and further spread of the disease.
The solution to the COVID-19 pandemic is at hand and it could substantially reduce deaths in Florida and the USA. Both the Pfizer/BioNTech and Moderna vaccines have proven to be highly effective with generally mild side-effects. One question is how to get them distributed most efficiently to minimize the future death count. So far healthcare workers and nursing home residents have been the phase 1 recipients. The CDC has recommended that frontline essential workers such as first responders, teachers, and grocery workers, and those 75 and over should be next in line. In Florida Governor DeSantis has opted to make those 70 and older go to the front of this second group with the reasoning that they are much more vulnerable than 20-yrs old frontline workers. I agree.
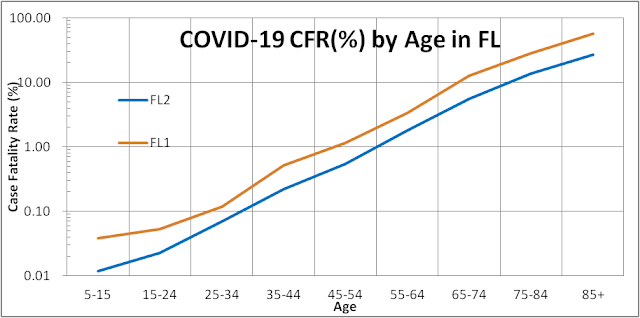
The overall risk of a population group should determine its order in the line for vaccines. This means the risk of infection multiplied by the risk of dying after being infected. Frontline workers could be ten times more likely to get infected since they interact with more people every day. However, a 75-yrs old has a 200 times greater case fatality rate (CFR = fatality/cases) than a 25-yrs old, with a CFR of 9.0% versus 0.045%, respectively (see blue line in the figure below). Thus a 75-yrs old would still be 20 times more at risk overall than a 25-yrs old frontline worker.
Moreover, the third wave that is currently raging in Florida which has thus far focused on the young student population is slowly transferring to older adults just as they did in the second wave this past summer (see figure below). Large family gatherings for Thanksgiving and Christmas will accelerate this transfer and endanger the older more vulnerable population.
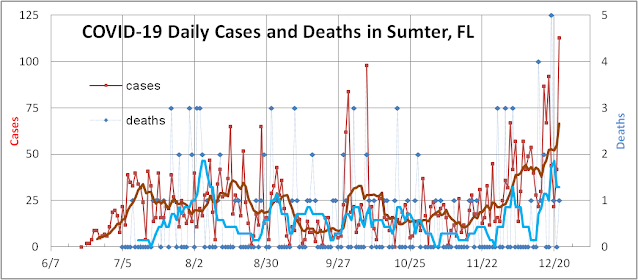
We see this happening in an alarming way in Sumter County which overlaps most of The Villages. Cases there have been increasing this month (see figure below) and yesterday 76 out of 112 newly confirmed cases were 65+ yrs old. As noted above this group has a CFR of 9%.
It could be a close race between the virus and the vaccine to see how many people in The Villages can be vaccinated and saved before they are infected and killed by the novel coronavirus. To further optimize the effectiveness of the limited supply of vaccines we recommend that those who have acquired natural immunity go to the back of the line of this second group, and to make sure that as many as possible get their first shot of these two-shot vaccines before anyone gets their second shot.
Most COVID-19 infections evolve from exposure to positive tests to hospitalizations to deaths. This well-defined pattern allows us to forecast the pipeline of confirmed cases to hospitalizations to deaths with a fair amount of accuracy. For example Thanksgiving travels and gatherings exposed a large portion of the population to the novel coronavirus causing positive test cases to rise now, 7-10 days afterward. 5-7 days after that the serious cases go to hospitals. Another week later they result in a favorable discharge or death.
When the community infection rate is high and the positivity measure (percent of tests returning positive) is high, only the serious cases get tested as in the early days of the pandemic this spring. The average lag time from cases to deaths was only 5 days and the case fatality rate (CFR = deaths/cases) was also high (see figure above). As testing availability improved and the positivity rate dropped and more asymptomatic and mildly symptomatic cases were identified, the lag time between cases and deaths increased to 15 days in the second wave. The median lag time between case date and death date is reported is now close to 20 days as some states such as Florida take up to 4-6 weeks to actually report some deaths. The longer the lag time the more difficult it is to model CFR and forecast the daily death rate. The summer peak in cases led to some deaths that were reported in a timely fashion but a large number of cases took many weeks to resolve due to real extended times for treatment but also due to inefficiencies in the reporting process. When we compare cases to the actual date of death, the relationship becomes much tighter (see figure below).
The peak in daily death count actually followed the peak in case count by 15 days as did the rise and fall in this second wave. The potential pitfall in this comparison is that deaths associated with the third wave is barely seen in the data as death counts bottomed at the beginning of November and are just beginning to rise (with the data for the last 5 weeks is still incomplete. Some COVID deniers use this to say that the actual death count is still flat for the third wave – discounting the reality that it is flat because the count is incomplete.
Comparing cases to the actual date of death also allows us to measure the CFR better. During the first wave when little was known about COVID-19 and only severe cases were treated and lots of older patients died the CFR was near 4.5%. During the second wave, younger and asymptomatic and mildly symptomatic cases were uncovered and the overall CFR dropped to near 2.0%. The third wave involved even younger patients as schools reopened and the CFR is currently near 1.8%. CFR also improved over time due to improvements in treatment plans (proning) and therapeutics (remdesivir, dexamethasone, and bamlanivimab). Some of this improvement though could be reversed if hospitals and health resources in the USA become overwhelmed as they are in certain regions of the country.
Thus far Florida has fared much better than the rest of the country in this third wave partly because of the Sunshine State’s milder weather and hospitals are only filled to half of the peak this past summer (see figure above). But the increase in national travel for the holidays and a decrease in temperature in Florida could make the third wave worse than the first two in Florida.
Currently, there is a very small number of Americans that have gained immunity from vaccination trials. The FDA would probably approve the Pfizer vaccine by Dec 10th and the Moderna one by Dec. 20th. By the end of this year, Pfizer and Moderna would have supplied enough vaccines to permit 20M Americans to have had their first shot. By early next year, 19M Americans would have gained immunity from these two shot vaccines (taking into account the current estimated 95% effectiveness of these vaccines). Many people estimate that enough vaccine would be available to vaccinate 25M-30M Americans every month in 2021 subject to logistical and psychological constraints (deep blue area in the graph below). Thus vaccine “herd immunity threshold = 230M” could be reached in the USA by the end of summer.
Herd immunity could actually be reached sooner than that. Currently over 14M Americans have gained immunity from being infected by SARS-Cov-2. The immunity may not be perfect but seems to be at least 99% effective for 6 months. We project that by yearend 19.5M Americans will have tested positive for COVID-19 (red area). Due to testing bottlenecks and scarcity, there is a hidden population of asymptomatic and mildly symptomatic cases that we estimate to be twice as big as confirmed cases for a total of 42M currently immune and 55M immune by yearend (red+green areas). The total infected has been estimated to be as high as 8x by the CDC or 111M currently (red+green+purple areas). We consider this to be highly unlikely for the USA as a whole even though antibody surveys for small sections of the USA have ranged from 2x to 20x the confirmed population. If we adopt our best guess estimate for total immunity, we project that it will exceed the threshold for herd immunity by mid-year and stop exponential growth in the USA.
The CDC has established guidelines for prioritizing vaccinations among different groups of people (healthcare workers, and residents of long-term care facilities). But they omitted to spell out who in those groups should be vaccinated first. In fact, we believe that everyone should be tested for antibodies before they are vaccinated. This would allow scientists to:
1. optimize the distribution of an initially scarce vaccine to those who really need it,
2. provide a baseline and periodic retests to measure how effectively these new vaccines are producing antibodies
3. provide us with detailed measures of the true population of infectees.