SARS-CoV-2 is still ravaging the world 2.4 years after it first appeared in China. For the first 2 years, many countries were vigilant in the defense of their people against the spread of COVID-19 but since early this year many countries have given up the fight assuming that with the wide availability of effective vaccines Omicron is mild enough to live with and too contagious to resist.
Taiwan and mainland China were both hit with the latest Omega subvariant BA.2 in March. While China has continued with its zero-COVID policies, Taiwan gave up on its zero-COVID policy 4 weeks ago along with most other countries. The results show how rapidly and explosively the virus can spread with few mitigations in place.
Cases are growing exponentially in Taiwan with 17k new cases reported yesterday while China reported 7.4k. If China had dropped its zero-COVID policy a month ago, it could have reported 1M new cases yesterday (scaling up Taiwan’s numbers). While there has been tremendous criticism of China’s draconian COVID policies, 1M cases/day would have elicited huge global criticism.
The real question is how will Taiwan’s hospitals handle the potential influx of patients and how many people will die. We believe the current death rate in Taiwan reflects case counts from two weeks ago and so the ultimate death toll may be 15X higher or 0.5 per million or 12 deaths/day. Taiwan may have decided that this is a death toll, mostly among the elderly and immunocompromised, that they are willing to live with; for China 700 deaths/day may be too horrendous.
It seems many governments are determined to expose as many of their citizens to the Omicron variant as possible on the assumption that Omicron is mild. As states and countries rush to drop #COVID19 mitigation measures such as masking and social distancing against CDC and WHO guidance, it is more important than ever for the elderly and the immunocompromised to learn how to fend for themselves (in consultation with their doctors).
2. For the 10M Americans who are immunocompromised or at high risk, it could be helpful to get Evusheld monoclonal antibody treatment pre-infection as a prophylactic. Prescription necessary.
3. Test using at-home rapid antigen test kits, and rapid PCR test facilities at the first sign of symptoms or suspicion of exposure
4. It is important for everyone to line up scarce monoclonal antibody treatments such as sotrovimab and bebtelovimab for post-exposure treatment to reduce hospitalizations. Remdesivir has also proven to be effective against Omicron. Paxlovid and molnupiravir are 2 antiviral pills that may reduce the chance of hospitalization. Typically these therapeutics must be taken within 5 days after exposure to be effective. Prescription necessary.
Many governments are assuming that the Omicron variant will be mild enough to manage on an endemic basis. The data does not really support this. Without any mitigation measures, COVID-19 cases and deaths are soaring in Denmark.
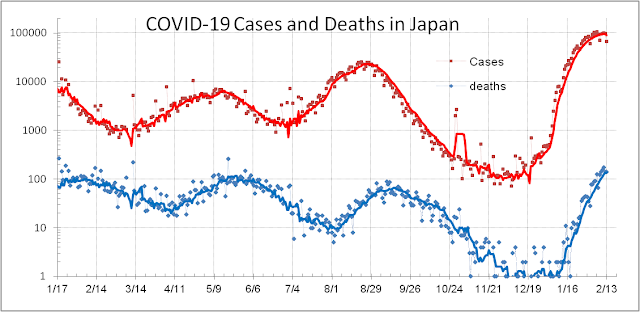
Even with increased mitigation, Japan is having a tough time reining in Omicron and it will suffer more deaths through this “mild” cycle than it has throughout the history of this 2-yrs old pandemic. Protect yourself since your government and some fellow citizens don’t want to.
Living with COVID-19 has become the catchphrase of the Pandemic recently even though the WHO warns that it is too early to relax our vigilance. Pandemic weariness has taken hold and many people just want to resume “normal” life. Moreover, some countries that have experienced the more contagious but milder Omicron variant and survived its strain on their hospital systems have encouraged others to think that they might also be able to manage the crisis just as well.
What are reasonable benchmarks to use to mark the transition of a pandemic to endemic phase that society can live with? One benchmark is seasonal flu which can kill 20k-30k Americans, and 300k-600k globally each year. Countries have built enough hospitals and have enough healthcare resources to handle such outbreaks each year without shutting down their economies. In the US 30M Americans develop symptoms of seasonal flu each year and 30k die so a case fatality rate (CFR = deaths/cases = 0.1%) seems to be acceptable. If this number dies over a period of 6 months, a mortality rate of 30,000/180/334 = 0.5 per million population per day, or 8 hospital admits per million pop per day are other equivalent benchmarks.
In early 2020, COVID-19 CFR for many countries approached 10% and hospitals were overwhelmed causing a lot of unnecessary deaths. Countries are now doing better with vaccines and therapeutics that have reduced the effective CFR for COVID-19. At one extreme is Denmark which is 81% vaccinated and 60% boosted. They removed all mitigation measures for COVID-19 on February 1st and are allowing the Omicron variant to infect everyone. 32% of all Danish have already been infected by the SARS-CoV-2 virus. Being highly vaccinated they had survived the Delta variant well with a lagged CFR (= deaths/cases 20-day lag) of 0.30%. Omicron, being more contagious, has infected and killed more Danes but with a CFR = 0.10% they feel they can now treat COVID-19 as endemic rather than a pandemic. As long as they continue to collect detailed information by age and other demographic dimensions to advise and protect the vulnerable this may be a path to “normality”. If new variants including the BA.2 turn out to be more problematic, they should be prepared to reimpose restrictions.
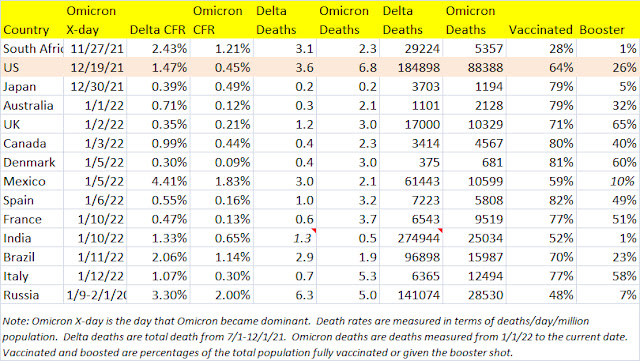
Other countries have had mixed success in living with Delta and Omicron (see table below where we list all major countries where Omicron has been dominant for the last 4 weeks). The UK has reduced their CFR for Omicron to 0.22% and essentially dropped most of their restrictions last week even as thousands of Brits are still dying each week. Australia, after 18 months of tight restrictions started to loosen up in mid-2020 just as the Delta variant hit. Its high vaccination rate kept its CFR at 0.71%. Late last year when the Omicron hit, cases soared but high vaccination and booster rates lowered the CFR to 0.14%, even as more Aussies have died in the Omicron wave (1,918) than the Delta wave (1,101). Spain and France have also fared reasonably well with the Omicron given their high vaccination and booster rates. They may follow Demark in loosening restrictions soon.
At the other end of the spectrum are countries like South Africa, Mexico, India, and Brazil who are less well vaccinated and boosted and are experiencing substantially higher death rates even with the Omicron such that it seems extremely dangerous to ease restrictions. Japan presents a unique and interesting case. Its death rate is one of the lowest at 0.2/day/million but its CFR at 0.59% for the Omicron is high, higher than it experienced for the Delta last Fall during the Olympics (perhaps due to better testing then). It should not let Omicron surge out of control.
Where does the USA stand in this changing landscape? The US had a very high CFR= 1.47% through the 5 months of the Delta wave. With more vaccinations, boosters, and better therapeutics it has improved the CFR to 0.48% for Omicron but it is still far too early for the US to consider COVID-19 as endemic. Vaccination and booster rates need to improve more. With an Omicron death rate of 6.4/day/million, it is much higher than it was for the Delta wave, 3.6, and remains one of the highest in the world. Omicron in the US is still 10X more deadly than seasonal flu.
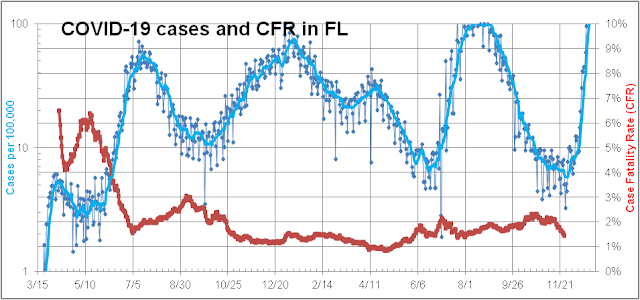
Ever since Florida switched its COVID-19 death reporting from as-reported date every day to as-of-actual date reporting aperiodically, death reporting has continued to confuse reporters, scientists, and database managers. Now other states are reporting a mix of these methods so it is very difficult to get an accurate measure of total deaths in the US. Furthermore, other countries have had similar issues with death reporting including not reporting or underreporting deaths totally compared to alternative methods which rely on excess deaths – current year compared to previous years’ averages.
We discuss 4 different ways that COVID-19 deaths can be tracked for Florida.
1. Health and Human Services (HHS) ask hospitals around the country to report deaths every day (red curve). It is the most accurate and timely way to track deaths but it does not count all deaths since many occur outside the hospital system.
2. Florida’s Department of Health (FL-DOH) reports deaths to the Center for Disease Control (CDC) every Monday and Thursday and they also generate a death count total on Fridays for public consumption. These reports allow us to reconstruct the as-reported death curve (green) which is complete and timely but not very accurate since it is not given daily and lags cases significantly.
3. The FL-DOH report also allows us to reconstruct the as-of-actual date death curve (blue) which is very accurate and complete. Its drawback is that this curve is continually revised and updated so the curve takes 8 or more weeks to be complete. So it is not timely.
4. Excess death reporting is perhaps the most complete but it takes even longer to generate so it is not very useful for tracking outbreaks like the current Omicron.
Why is it important to understand this for Florida and other reporting entities such as South African provinces? The reason is that the current Omicron outbreak method 3 (blue) is showing a declining death count suggesting that Omicron is extremely mild since no deaths are measured even after Omicron cases began their exponential growth 4 weeks ago on 12/7 in Florida. This creates a false sense of complacency among healthcare professionals and government officials. The red curve reflects the real fact that for the last 2 weeks COVID-19 hospital deaths have already begun to rise due to the Omicron variant. Omicron death rate appears lower than the Delta due to more vaccinations, boosters, and the younger average age of infectees. As we track this over the next few weeks we should be able to determine how much milder the Omicron might be intrinsically after adjusting for all these other factors. Almost surely it will not be the mild infection that many commentators are guessing and hoping for now based on South African (SA) data.
The same problem in death reporting has plagued SA reporting and for the first 4 weeks, after Omicron was discovered in SA in November, there were few deaths. This led everyone to conclude that Omicron is super mild. Over the last 2 weeks, deaths have been edging up even as cases are continuing to fall. The 2-8 week lag in death reporting is responsible for this lagged response.
It is important not to underestimate the virulence of SARS-CoV-2 even in the potentially milder Omicron version. As the WHO chief reminded everyone today, Omicron may be milder but it is not a mild infection. For countries such as Australia, India, Brazil, Canada, Mexico, etc. to not heed this warning is a major mistake that could cost millions their lives and livelihoods this year.
Ever since Florida switched its COVID-19 death reporting from as-reported date every day to as-of-actual date reporting aperiodically, death reporting has continued to confuse reporters, scientists, and database managers. Now other states are reporting a mix of these methods so it is very difficult to get an accurate measure of total deaths in the US. Furthermore, other countries have had similar issues with death reporting including not reporting or underreporting deaths totally compared to alternative methods which rely on excess deaths – current year compared to previous years’ averages.
We discuss 4 different ways that COVID-19 deaths can be tracked for Florida.
Why is it important to understand this for Florida and other reporting entities such as South African provinces? The reason is that the current Omicron outbreak method 3 (blue) is showing a declining death count suggesting that Omicron is extremely mild since no deaths are measured even after Omicron cases began their exponential growth 4 weeks ago on 12/7 in Florida. This creates a false sense of complacency among healthcare professionals and government officials. The red curve reflects the real fact that for the last 2 weeks COVID-19 hospital deaths have already begun to rise due to the Omicron variant. Omicron death rate appears lower than the Delta due to more vaccinations, boosters, and the younger average age of infectees. As we track this over the next few weeks we should be able to determine how much milder the Omicron might be intrinsically after adjusting for all these other factors. Almost surely it will not be the mild infection that many commentators are guessing and hoping for now based on South African (SA) data.
The same problem in death reporting has plagued SA reporting and for the first 4 weeks, after Omicron was discovered in SA in November, there were few deaths. This led everyone to conclude that Omicron is super mild. Over the last 2 weeks, deaths have been edging up even as cases are continuing to fall. The 2-8 week lag in death reporting is responsible for this lagged response.
It is important not to underestimate the virulence of SARS-CoV-2 even in the potentially milder Omicron version. As the WHO chief reminded everyone today, Omicron may be milder but it is not a mild infection. For countries such as Australia, India, Brazil, Canada, Mexico, etc. to not heed this warning is a major mistake that could cost millions their lives and livelihoods this year.
The Omicron variant of SARS-Cov-2 is highly transmissible with a doubling time of near 2 days. It has now spread into over 100 countries globally and is spreading rapidly throughout all 50 states in the US. 1M Floridians and 10M Americans could be infected before the end of January.
Luckily Omicron appears to be less virulent than the Delta variant, but more importantly, it is arriving at a time when the developed world is well vaccinated. This means that the majority of cases will affect 3 different groups:
1. unvaccinated who are mostly young and who are less susceptible to hospitalizations and deaths (as in South Africa)
2. vaccinated folks who while susceptible to infections are still well protected against serious illness by 2 doses and sometimes 3 doses (as in Denmark). Breakthrough probability is much higher with the Omicron than the Delta
3. reinfections of middle-aged adults who have survived an initial bout with COVID-19 but chose not to get vaccinated (older infectees disproportionally died already with earlier variants. Reinfections seldom occurred with prior strains but appear to be more likely with the Omicron.
Each one of these groups has lower hospitalizations and death rates than those experienced with earlier variants.
We have modeled the Florida Omicron risk by segmenting its population into these 3 groups and by age. We suggest that rather than the typical 10% seen in the past only 3% of Omicron infectees will get hospitalized. This good news is tempered by the fact that cases could rise to 2-3 higher than the Delta peak – straining the hospital system yet again. Moreover, pediatric hospitalizations could set new records as they are already doing in NY with unclear consequences for the future development of kids.
Case Fatality Rates (deaths divided by cases 2-4 weeks prior) should decrease from near 1.6% to 0.4% versus the Delta wave due to protection afforded by vaccinations and prior infections and younger age of the unvaccinated. This means that the death count in FL could reach 10k but should be below the 24.4k Floridian lives lost to the Delta wave.
This forecast depends on increased vaccination, boosting, and masking seen recently in FL continuing into January.
The Center for Disease Control and Prevention’s (CDC) slow and poor response has handicapped the US fight against the COVID-19 Pandemic. The latest example of their incompetence has cost ~8k Americans their lives including that of Colin Powell.
Since the first vaccines were given to Americans in December 2020, there were always nagging questions about how good were the vaccines’ efficacy, safety, and durability in real life. The vaccines were developed, tested, and approved remarkably fast causing many Americans to have questions. The correct approach would have been to collect as much data as possible afterward to determine the real-life efficacy, safety, and durability of these vaccines. Instead of doing this, the CDC arrogantly decided that breakthrough cases (infections after being fully vaccinated) would be rare and mostly mild and would concentrate on collecting select data for serious cases that resulted in hospitalizations and deaths. This was substandard compared to other countries such as the UK and Israel that collected much more thorough information.
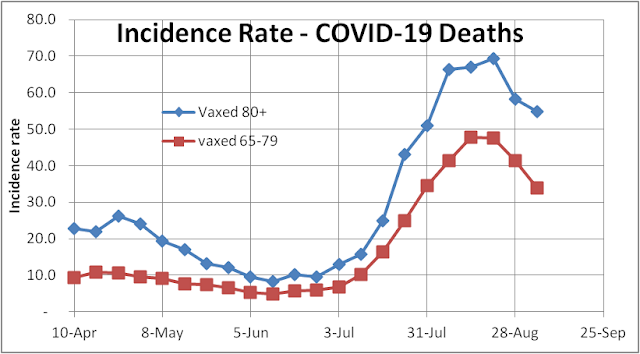
Since early July I began to question the wisdom of such a strategy and began collecting and analyzing the very crude weekly breakthrough reports that the CDC did provide. It was immediately clear to me that breakthrough hospitalizations and deaths were not rare as advertised but potentially a serious problem. For certain weeks, breakthrough deaths constituted near 9% of all COVID-19 deaths in the USA. I reported this and many dismissed the problem as mainly for seniors and the immunocompromised. I conceded that it may be true but lacking the detailed demographic and vaccine information that the CDC withheld from the public, there was no way to determine this for certain. In any case, it would not have been surprising were it the case because most states followed a senior’s first program to vaccinate seniors who were most vulnerable to the disease in January. Ironically this left seniors most vulnerable to the vaccine’s waning efficacy that began in June, 5 months after their second dose.
Seniors became the “canaries in the coal mine” sacrificed to die because the CDC failed to collect and release breakthrough data in a timely fashion. As it turns out in the more detailed data the CDC just released last week, they had information that showed Johnson and Johnson’s (J&J) single-dose vaccine was not as effective as people had hoped. This should have led them to ask J&J to go back and evaluate a two-dose strategy. The data also showed that both the Moderna and Pfizer mRNA vaccines were showing signs of fading. This showed up in real-world death counts as the Delta gained strength in July. Breakthrough deaths suddenly began to rise.
Now with detailed CDC demographics data, we know the deaths occurred mostly in the 65+ population.
The CDC, of course, saw all this but their public message even last month was still that breakthrough cases, hospitalizations, and deaths were rare – lulling seniors into believing that boosters were not necessary. Coupled with the CDC decision to relax indoor masking requirements for the vaccinated, this became deadly. By early August it was hard to deny the truth and the White House announced an aggressive schedule to roll out boosters by mid-September.
Unfortunately for some mysterious and possibly criminal reasons, the CDC decided not to share this information with the Food and Drug Administration (FDA) or any other scientists so that the FDA delayed scheduling their first meeting to consider boosters to 9/17 much later than they should have. In the meantime the CDC’s lack of transparency caused critics to say that the President was not following the science but instead influencing the science. The FDA was also not blameless in this fiasco because when they finally did meet they reviewed the UK and Israeli data but considered American data crucial and lacking. This was extremely parochial of them. The virus does not care whether it infects Americans, Brits, Israelis, Asians, or whomever. The pandemic is a global one and the Israeli experience was highly relevant and informative. When the FDA and CDC finally approved the boosters on 9/24, 5 weeks behind the original target date, ~8k more fully vaccinated Americans had died unnecessarily because they did not have proper guidance or access to boosters. Now the CDC may be playing catch up again because the 55-65 yo that got vaccinated in March will soon experience waning vaccine efficacy. Such incompetence and interagency bickering are criminal and Congress should investigate why it happened so that it does not happen again.
We had warned two months ago that the CDC had erred in dropping the tracking of COVID-19 breakthrough cases and not doing more to track serious breakthrough cases with more detail. This has led to tremendous confusion and bickering among the White House, the CDC, and the FDA regarding the need and timeline for rolling out vaccine boosters. Somehow the FDA decided to ignore a lot of good data from the UK, Israel, Iceland, and Singapore regarding the seriousness of breakthroughs. Now the CDC is leaning toward quicker and broader booster rollout. Why?
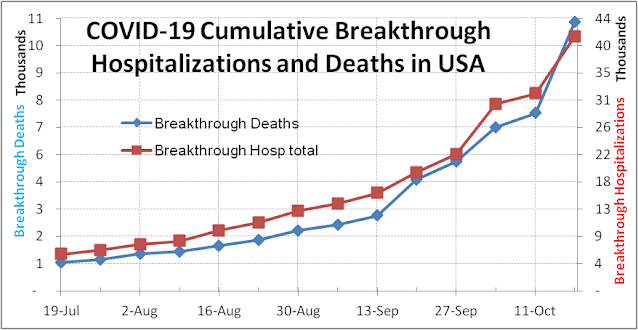
One reason is that yesterday, the CDC reported a big jump in breakout hospitalizations and deaths due primarily to the addition of one more state in their weekly report. Based on the trend over the last 10 weeks, everyone had expected 3,400 cumulative breakthrough deaths to be reported yesterday (red curve in graph above and table below). That they got 4,493 was probably a huge shock. It meant that the total breakthrough deaths over the last 10 weeks were ~3,300, 37% higher than the 2,400 they had expected. This meant that the USA had 37% more breakthrough deaths due to the Delta and vaccines waning than they had thought just two days earlier. The graph above shows how the new cumulative breakthrough death curve (blue) might look like had all 50 states and territories reported consistently all along.
How could this happen? One state probably just acknowledged that they had 1,060 breakthrough deaths that they had not counted/reported before this week and that every week’s breakthrough deaths for the USA over the last 10 weeks had been understated by ~28% and breakthrough hospitalizations by ~15%. On July 12, the CDC breakthrough death count should have been ~1,200 rather than ~1,063, and on 9/20 it had grown to 4,493 due to a very virulent Delta variant.
That this included a large historical restatement does not make it any less significant for the CDC or the USA – it is equivalent to NY finding out that they had undercounted the number of nursing home deaths due to COVID-19 last spring and had to make a data dump to correct. It means that the prior CDC narrative that breakthrough deaths are rare is wrong and is far more likely than they had thought. Rather than admit that they had mismanaged data again (for the nth time), Dr. Walensky decided to broaden booster usage on her own yesterday – mystifying thousands of scientists and reporters. The truth is the USA needs boosters to stem the current surge almost as much as they need to vaccinate more people.
Russians headed to polling stations across the country this past weekend to vote in a totally new lower house of parliament. Despite very little notice in the West COVID-19 is a driving factor in the elections and for a good reason. The Delta variant is hitting Russia very hard.
For much of 2020, Russia claimed they had a good handle on the global pandemic and while they saw surges in cases, they reported better than average case fatality rates (CFR) of 1.6% for most of the year. Further, they claimed to have developed a vaccine, Sputnik V, that provided good protection against SARS-CoV-2 infections. Mass distribution began in Dec 2020 near the same time as in the US. Things worked out pretty well in early 2021 as cases and deaths dropped, but as the Delta variant began to spread in May 2021 a third and most deadly wave hit Russia.
What went wrong? Assuming that the COVID data from Russia is of average quality (big assumption), it seems that the Sputnik V vaccine is virtually useless against the Delta variant despite a claimed efficacy of 80% against hospitalization. CFR more than doubled over the last 6 months to 3.8% – one of the worst in the world even among countries that were totally exposed and unvaccinated. This is 10X worse than Japan’s experience with Delta. COVID stats from Russia are highly suspect, so the real toll could be 28% higher vs. 20% higher for the USA. COVID-19 could be inflicting tremendous pain on Russians. Moreover, in recent weeks, cases rose again after falling for nearly 3 months as schools reopened in September in Russia with no masks or social distancing.
Russia’s death/day/1M capita is near 6 – nearly the same as the USA. Russia’s problem may be a rushed and ineffective vaccine. What is the USA’s excuse for such a high death count and poor performance when we have some of the best vaccines in the world? Superior western science has given Americans a solution that demagoguery is rejecting. Is Russia’s state-managed science worse than America’s state-mangled science?
Why has Governor DeSantis spent so much time since early August pitching $2,100 Monoclonal Antibodies (MAB) as his solution for the pandemic when there are cheaper and more effective solutions such as $20 vaccines and $0.20 masks that have been used by a thousand times more people safely to reduce SARS-Cov-2 infections and deaths? MAB does have a very useful purpose: they serve to help high-risk patients who have been infected as a second line of defense; they are expensive and should not be given as frontline defense until cheaper and more durable versions are made.
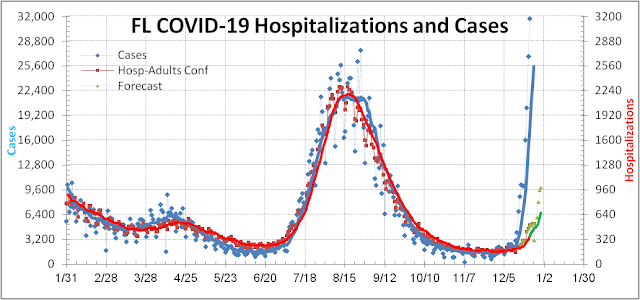
The original reason seemed to be that Governor DeSantis wanted to do his biggest donor a favor. But now that the country has run out of Regeneron MAB and everything is back-ordered, and states are on allocation, he continues to complain and push a false and dangerous narrative. Does he really think that he is fighting for the average Floridian by doing this? Today he boasted that since he has been promoting MAB Florida has given out 100,000 MAB doses at a cost of $210M to the Federal government. He claims that hospital admissions have been reduced by 60%. True statements but one have nothing to do with the other. Adult hospital admissions (red curve in the figure below) have historically shown a strong correlation with total cases (blue) especially over the last 8 months: about 10% confirmed COVID-19 cases result in hospitalizations. The data has continued to show the same high correlation over the last 6 weeks that he has been pushing MAB.
There was a brief three-week period associated with school reopening when the number of kids 19 and younger constituted more than 30% of all cases and caused the total number of cases to blip up. But since then the two curves resumed matching each other very closely. If MAB had a real beneficial effect one would expect the red curve to drop significantly below the blue curve. The reason that this has not happened is that there was no requirement for MAB users to have tested positive for COVID-19; they received MAB on the basis of a self-claimed exposure to COVID-19. There was also no requirement to show proof of vaccination, or a doctor’s prescription to prove that the person is a high-risk patient. This allowed many Floridians to use MAB as a substitute for vaccination. This is totally wrong.
There are 10M Americans who are immunocompromised. Most of them have been vaccinated and many of them have received a third shot. Yet a significant percentage of them have not gotten strong protection from the vaccines due to their weakened immune system. For millions of these people masking and isolation is a fact of life. Unfortunately, many of them get COVID-19 nevertheless. It is believed that many of the 10,000 breakthrough hospitalizations over the last 8 weeks are associated with this immunocompromised population and older people who generally have weakened immune systems. 100,000 breakthrough cases associated with the 10,000 hospitalizations (using the 10:1 ratio of cases to hospitalizations found above) could have used the MAB and could have been spared a trip to the hospital. Instead, Governor DeSantis deprived them of their only path to safety and allowed unvaccinated and low-risk people to use up the available supply of MAB. I take this insult personally because I am one of the 10M immunocompromised Americans who may now have to wait for supply to catch up with demand or die in the interim.
For the first 15mo of the global pandemic, many analysts had held up Taiwan as an exemplar for how to handle a pandemic. They had experienced only a few hundred well-monitored cases and only 7 deaths from COVID-19 for 15 months. During this same period, Singapore also did very well. They weren’t able to avoid infections with a high number of guest workers in a fast-growing City-State but they kept their case fatality rate low (CFR = 0.06%) due to a young population and a good healthcare system. Japan, being a larger country with many International ties experienced all the travails of the global pandemic in 4 waves matching more or less those of the USA and the rest of the world. They had a CFR that was near 2% – quite good for a population with high median age. The fates of the 3 have diverged dramatically with the arrival of the Delta variant this Spring.
Taiwan’s island nation status allowed them to isolate themselves from the storm raging outside in 2020. Then they relaxed their vigilance and allowed a few airline personnel to come into contact with Delta and then they rapidly lost control. Moreover, they got too complacent and did not push vaccinations very hard so much of the country was unvaccinated when Delta hit and Delta hit hard. The CFR for Taiwan for Delta is a horrendous 5.3% – a tribute to the contagiousness and virulence of the Delta and a sign of how unprepared Taiwan really was to fight a serious pandemic.
In Singapore, they were able to fend against Delta fairly well until just 2 months ago – then Delta hit hard. Cases soared and now deaths are soaring as well. The CFR appears to be 0.3% or 5 times worse than prior but could well be 10X worse when this infection wave passes. Curiously Singapore is one of the better-vaccinated countries in the world so that many of these cases and deaths must be breakthroughs.
Finally, for Japan their Delta invasion came coincident with the Olympics. Cases edged up in the weeks before the Olympics start as athletes arrived to prep for the Olympics and peaked within 10 days after the end of the Olympics. At the peak, cases were nearly 3 times higher than for any prior peak. However, it looks like CFR will be just 0.32% for this fifth wave. How did Japan manage to do better against the Delta than prior variants when they had experienced CFR = 2.0% in wave #4? One possible answer is that the median age of infectees had dropped for the Olympics. Japan was just beginning to vaccinate its people and it started with the older, more vulnerable part of the population who were by nature more cautious and masked or stayed home. The real answer may not be known for a few more months, though.
Against the Delta, the good turned in poor performances and the bad turned in better performances. The Delta variant continues to confound scientists and governments. Some are saying that if a highly vaccinated and masked Singapore can experience a Delta surge – no country is safe. The most prudent approach is to assume that with the Delta we are dealing with an entirely new contagion that requires high vigilance and much more study.

.bmp)


