The number of daily confirmed COVID-19 cases in Florida and several of its major cities such as Miami, Tampa, and Orlando continues to rise exponentially (with Orlando showing a doubling time of 4 days). The latest data shows a surge to record high levels (7-day average) in Orange (brown squares against right axis) and Miami-Dade (blue diamonds against left axis) Counties.

Orlando, Tampa, and Miami are now more dangerous than any part of Metro-NYC is, and Florida is now hotter than any other state (as indicated by its doubling time of 9.5 days, which is the shortest of any state). COVID-19 cases surged and will continue to surge higher in Florida for the following reasons:
- Huge crowds on Florida beaches for Memorial Day weekend, 5/23-25 that showed up as new cases beginning in June
- Hundreds of thousands watching SpaceX launch attempts on 5/27,5/30 without masks and social distancing on the Space Coast that showed up as new cases in Orlando
- Ongoing protests against racial injustice soon after George Floyd’s death on 5/25 that are showing up as increased case counts now.
- Universal Studios reopened on 6/5 and Disney World will reopen on July 11th .
- Florida entered Phase 2 reopening on 6/5 (with the exception of Palm Beach, Broward, and Miami-Dade counties that are now in Phase 1).
- The spread of the Pandemic to Latin America in May that led to the recent travel ban from Brazil that should have also been applied to other countries such as Peru, Chile, Mexico, Ecuador, Colombia, etc. Hundreds of millions of Latin Americans visit Florida (mostly Miami and Orlando) each year.
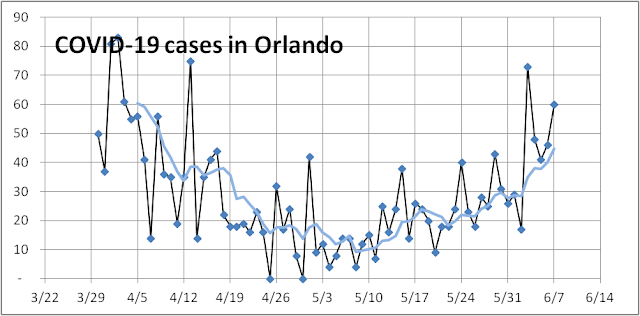
The novel coronavirus can take about 5–14 days to incubate before an infected person starts showing symptoms and register as a confirmed case. So even though case counts stopped declining and started to rise slowly shortly after May 4th reopening (see figure below) it did not surge until later in May. Moreover, this resurgence in cases is not confined to the three hot counties of Palm Beach, Broward, and Miami-Dade but it has spread to Hillsborough, Orlando, Pinellas, and the rest of Florida. The brown squares track the number of daily new cases (left axis) and the blue diamonds track the number of daily new deaths (right axis). The case fatality rate (CFR = deaths divided by cases) has held near around 4.5% (the ratio of the right axis to the left axis) with deaths lagging case identification by about 2 weeks. The first broad peak in Florida case counts occurred around 4/12 a broad peak in death count followed on around 4/28. The death count has averaged near 33 per day for the last 5 weeks, but we expect it to rise slowly in the next few weeks as cases turn into deaths or recoveries. Increased testing should have identified milder and asymptomatic cases associated with younger adults, so the CFR should be lower.

The recent resurgence in hospitalizations, however, makes us very pessimistic about Florida’s prospects. The brown squares (7-day averages) below show an increase in new hospital admits over the last two weeks and reached 200 yesterday. Yesterday 21,559 tests resulted in 17.7% positive cases – a terrible deterioration in the positive test rate from a low of 3% reached on 5/23.

The recent decision to hold the GOP Convention to Jacksonville will exacerbate the problem for Florida. The Governor of Florida promised to let the data and science guide reopening so he needs to halt reopening plans to assess the new COVID-19 outbreaks and make sure that testing, contact tracing, and selective isolation can keep up with the recent surge. The Mayor of Miami has already done so. If nothing is done statewide, the state may need to lock down again next month to prevent thousands of more Floridians from needlessly dying.